Overview
Second-year group project at Universiteit van Amsterdam, built end-to-end for a real client: Your Neon, an Amsterdam company making custom LED neon signs. The client's pain was concrete: customers would send a sketch, the founder would spend hours designing the sign and pricing it, and many customers would back out once they saw the price. We replaced both steps (visualisation and pricing) with an algorithm a customer can run themselves.
How it works
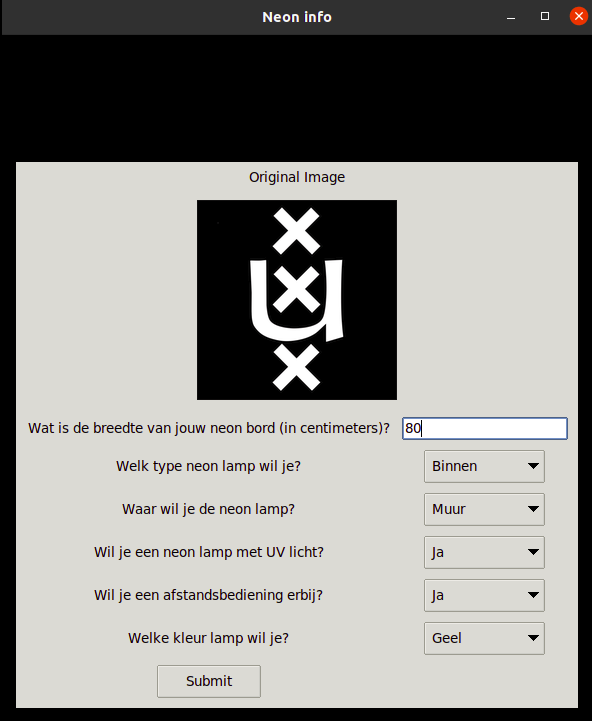
Given an input sketch and a desired sign width, the system runs:
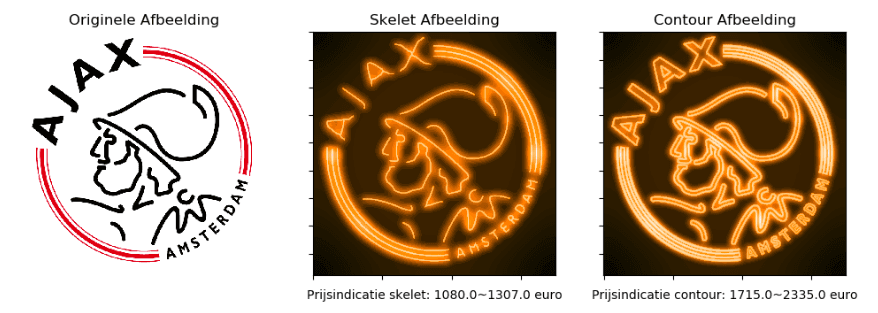
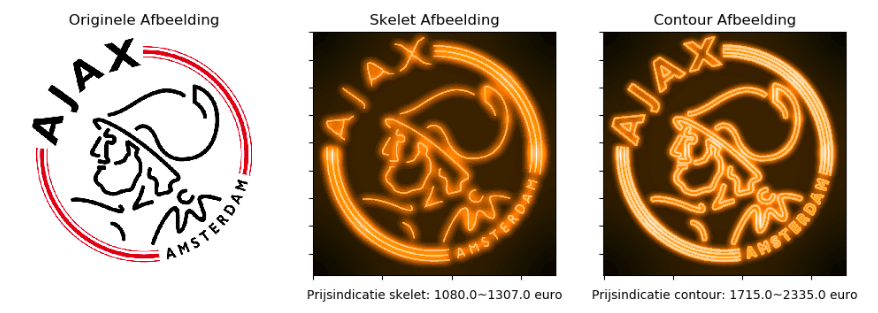
- Preprocessing. Greyscale + Otsu thresholding to isolate the salient object. This handles the colour sketches and logos customers actually submit, including white-on-coloured backgrounds.
- Edge or skeleton extraction.
- Contour mode traces outer edges (for outlined designs).
- Skeleton mode extracts the centerline (for filled shapes). The user labels which mode applies; we tried to auto-detect but the dataset wasn't large enough to train a reliable classifier and a hybrid blur-then-skeletonise heuristic didn't work for designs with multiple objects.
- Length measurement. Arc length over the pixel-wide trace, then converted to meters using a bounding-box crop and the customer-specified width to remove the effect of camera distance.
- Price estimation. Feeds the length into the client's existing pricing formula (LED strip cost, packaging, shipping, accessories, placement).
- Neon visualisation. Stacked Gaussian blur layers over the trace simulate light diffusion, with a coloured backdrop layer. The blur thickens a 1px line to approximate a real 6mm LED strip and the bright-centre / dark-edge falloff mimics actual neon glow.
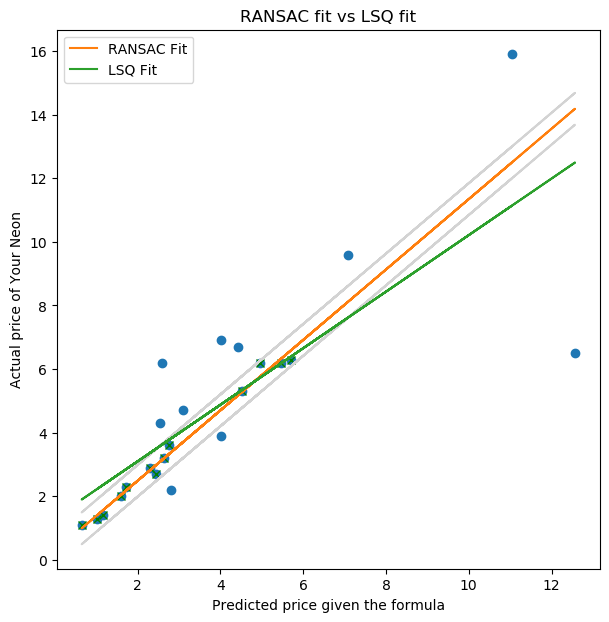
The pricing model and why we didn't use a neural network
The first attempt at length-to-price was a small feedforward neural network. The dataset (the client's historical orders) wasn't large enough to train it without overfitting, so we switched to linear regression. Plain least squares was too sensitive to outliers in the historical pricing data, so we used RANSAC instead.
After RANSAC fitting, the predictive models had:
- 17% mean error on contour designs
- 22% mean error on skeleton designs
Two separate models because contour and skeleton designs price differently per pixel-meter.
Delivery
Delivered as a Tkinter GUI the client can hand to customers: pick an image, set width, choose colour and placement (wall vs ceiling), output is the visualisation plus the price estimate for both contour and skeleton interpretations. The customer can self-serve without anyone at Your Neon spending hours on a design that may not convert.
Stack
Python, OpenCV (Otsu thresholding, arc length, blur stacks), Canny edge detection (early experiments), RANSAC linear regression, Tkinter.